If you read “Let’s Raise Children Who Won’t Have to Recover From Their Childhoods” one of my more recent blog posts about violence against children in homes and schools in Nepal, you will have noticed that some charts were missing, namely charts 4, 5 and 6! As a matter of fact, many more were not included. And those are what this blog post is all about.
The missing ones compare child discipline method in the (five) Development Regions and (three) Ecological Zones as well as results of surveys taken at two different times.
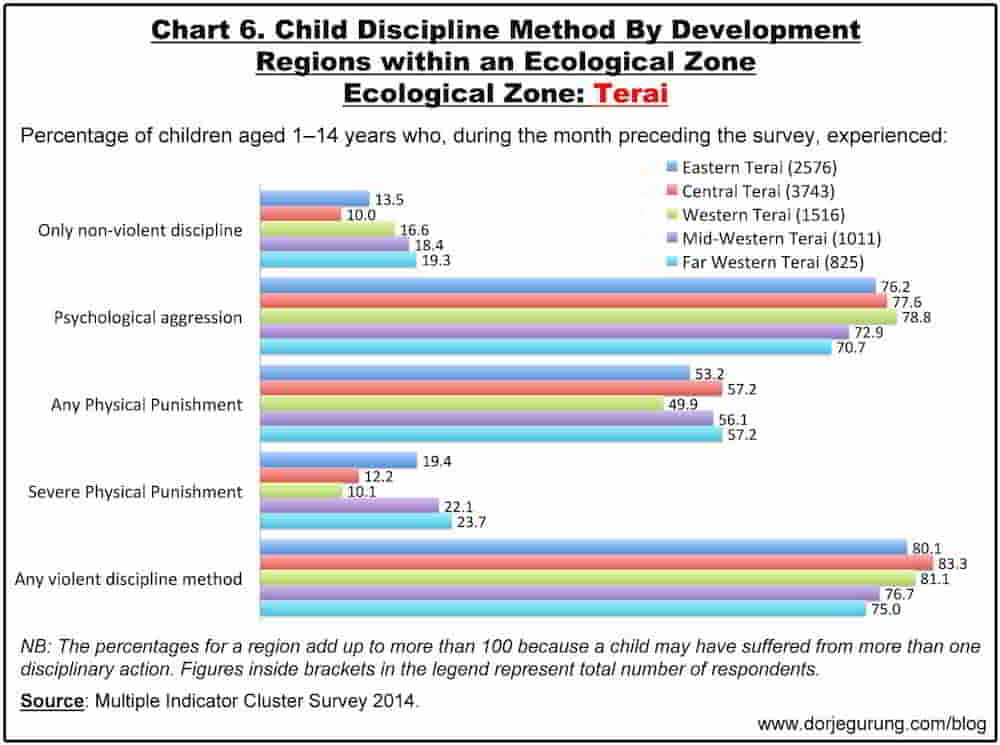
The following charts show how discipline methods compare within an Ecological Zone.
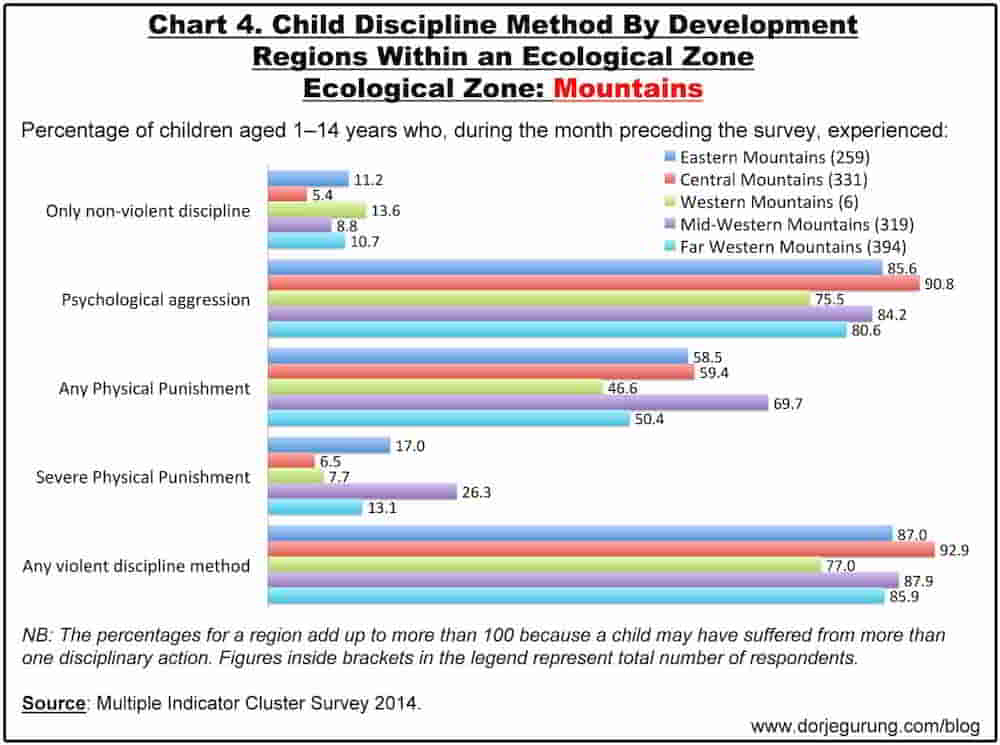
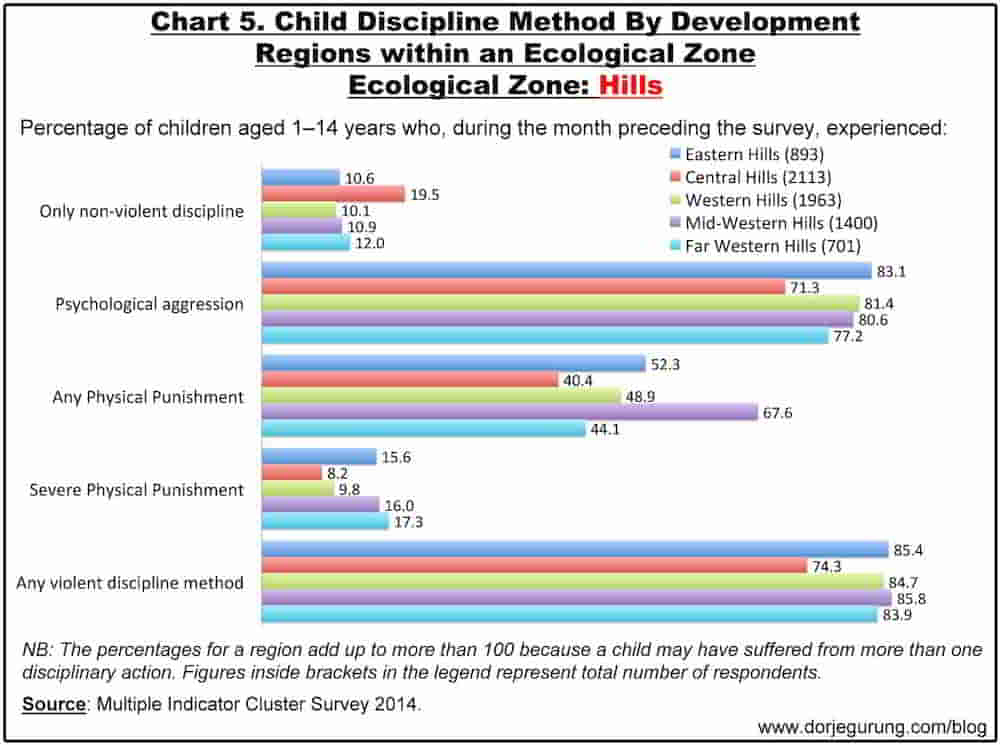
 Central Hills and Western Mountains are two that stand out as being different from the rest. However, the results of Western Mountain was based on responses from just 6!
Now for a comparison between Development Regions. The survey data reported in MICS 2014 was broken down by Ecological Zone within a Development Region. Arriving at Development Region data was simply a matter of converting the percentages into absolute numbers and then converting it back into percentage for the Region. The results are shown below.
| Development Region | Percent of children aged 1–14 years who experienced: | Number of children aged 1–14 years | ||||
| Only non- violent discipline | Psychological aggression | Physical punishment | Any violent discipline method |
|||
| Any | Severe | |||||
| Eastern Total | 471 | 2927 | 1989 | 683 | 3051 | 3,728 |
| Central Total | 778 | 3770 | 2421 | 695 | 3941 | 6,187 |
| Western Total | 451 | 2797 | 1719 | 346 | 2897 | 3,485 |
| Mid-western Total | 367 | 2134 | 1736 | 531 | 2257 | 2,730 |
| Far Western Total | 286 | 1442 | 980 | 368 | 1545 | 1,920 |
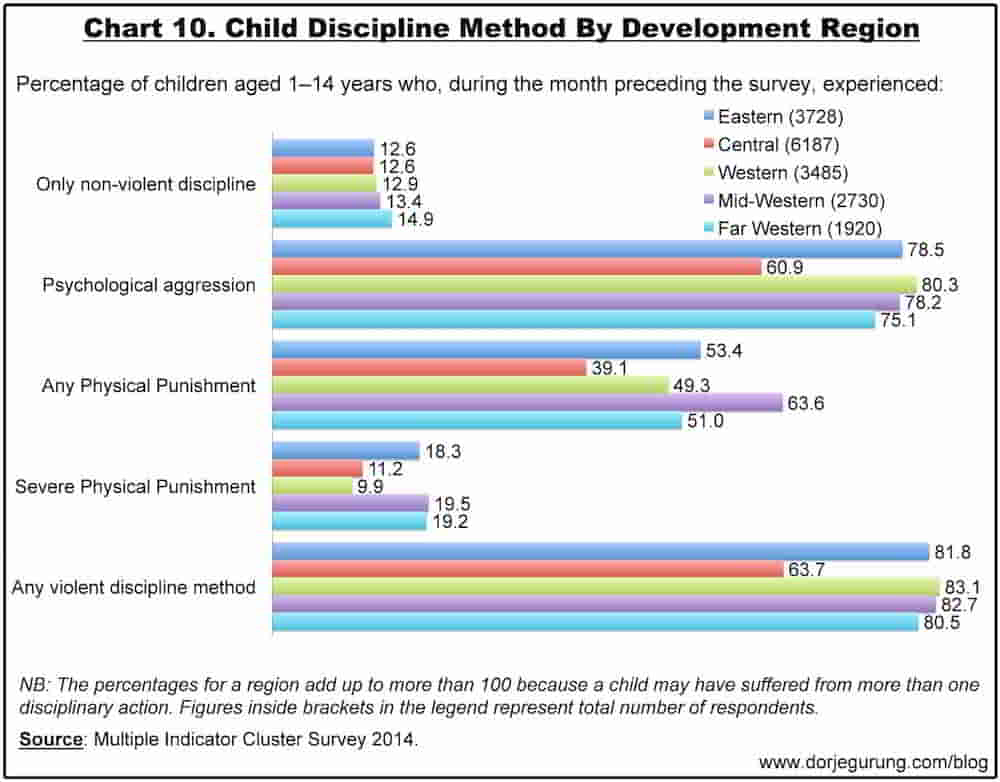 As you can see, containing Kathmandu Valley, with its highest concentration of the wealthy and the educated, not surprisingly Central Development Region stands out.
Now for the Ecological Zones.
| Ecological Zone | Percent of children aged 1–14 years who experienced: | Number of children aged 1–14 years | ||||
| Only non- violent discipline | Psychological aggression | Physical punishment | Any violent discipline method |
|||
| Any | Severe | |||||
| Mountains Total | 118 | 1113 | 772 | 202 | 1156 | 1309 |
| Hills Total | 942 | 5516 | 3536 | 850 | 5785 | 7070 |
| Terai Total | 1319 | 7382 | 5307 | 1528 | 7805 | 9671 |
The people residing in different ecological zone vary greatly in language, culture and tradition. While those in the Mountains, the indigenous population are mostly Buddhists, in the Hills and Terai they are Hindus. Granted, people living within an ecological zone are NOT homogeneous, especially those living in the Hills. However, on average, the difference in language, culture and tradition between peoples within is significantly less than between peoples in different ecological zones.
Hence the following chart.
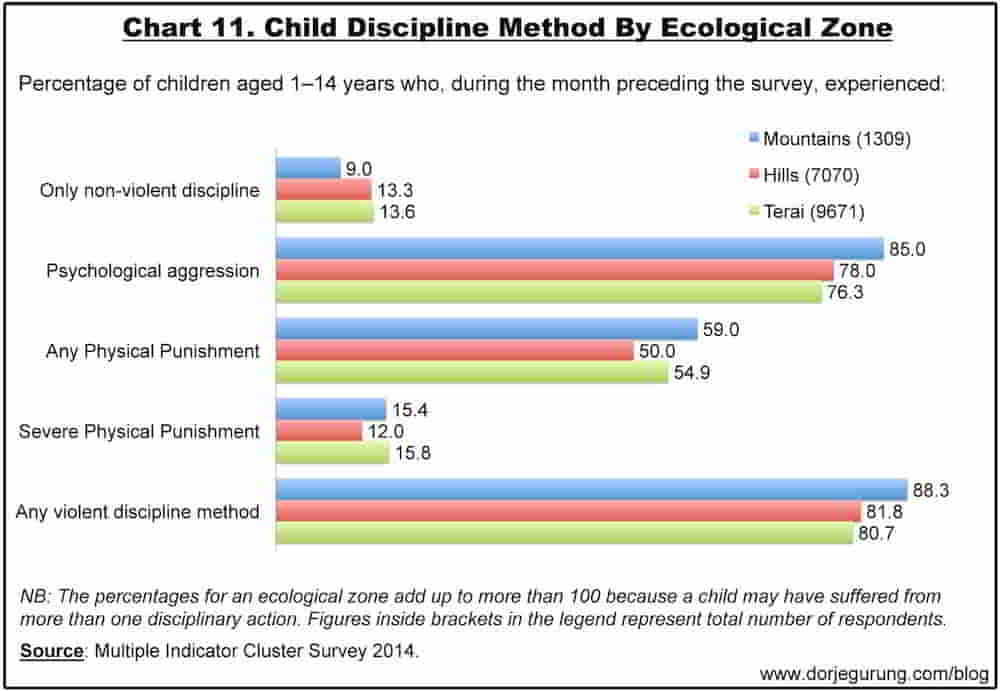 Mountains stand out from the other two…as they normally also do! 😀
I was also interested in looking at whether there have been changes in the discipline methods over time. For that I went looking for surveys conducted at another time. Turns out Multiple Indicator Cluster Surveys have been conducted three times in Nepal, but the I just couldn’t get my hands on the first one conducted in the mid-nineties. The second one was conducted in 2010 but only in Mid-Western and Far-Western regions.
Four years is not a long enough time for significant changes in behavior to occur in a population. In spite of that, I went ahead and produced the following comparison charts about discipline methods used in 2010 and 2014, which are reproduced below without any comments.
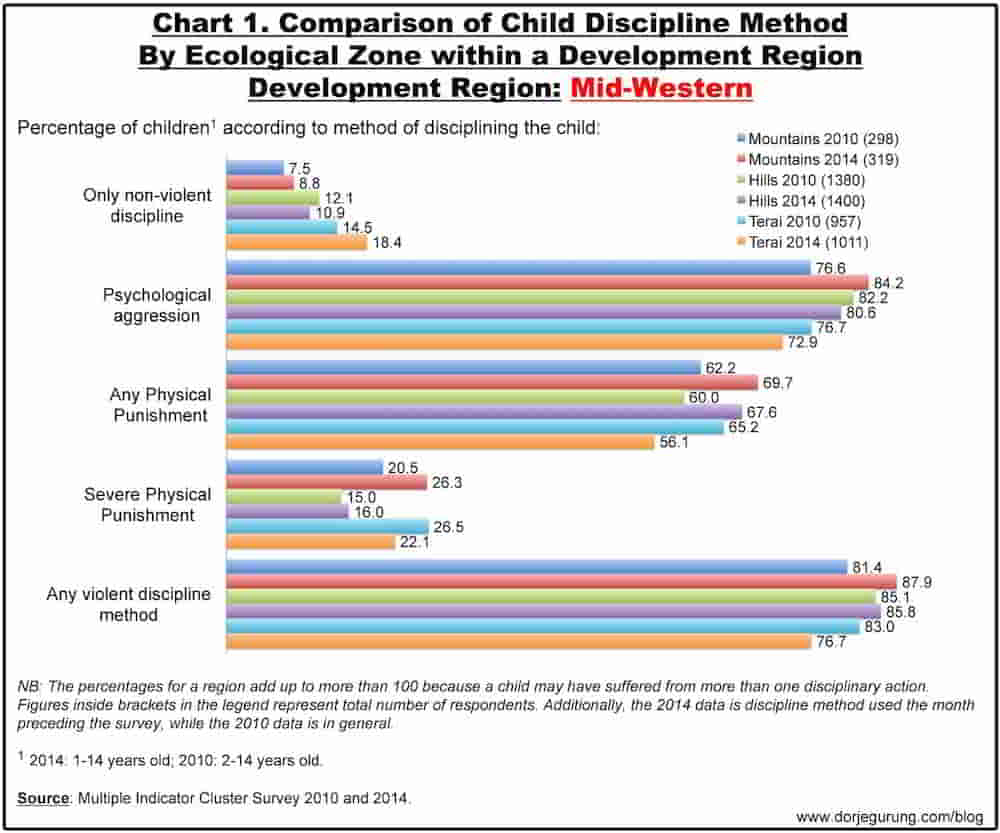
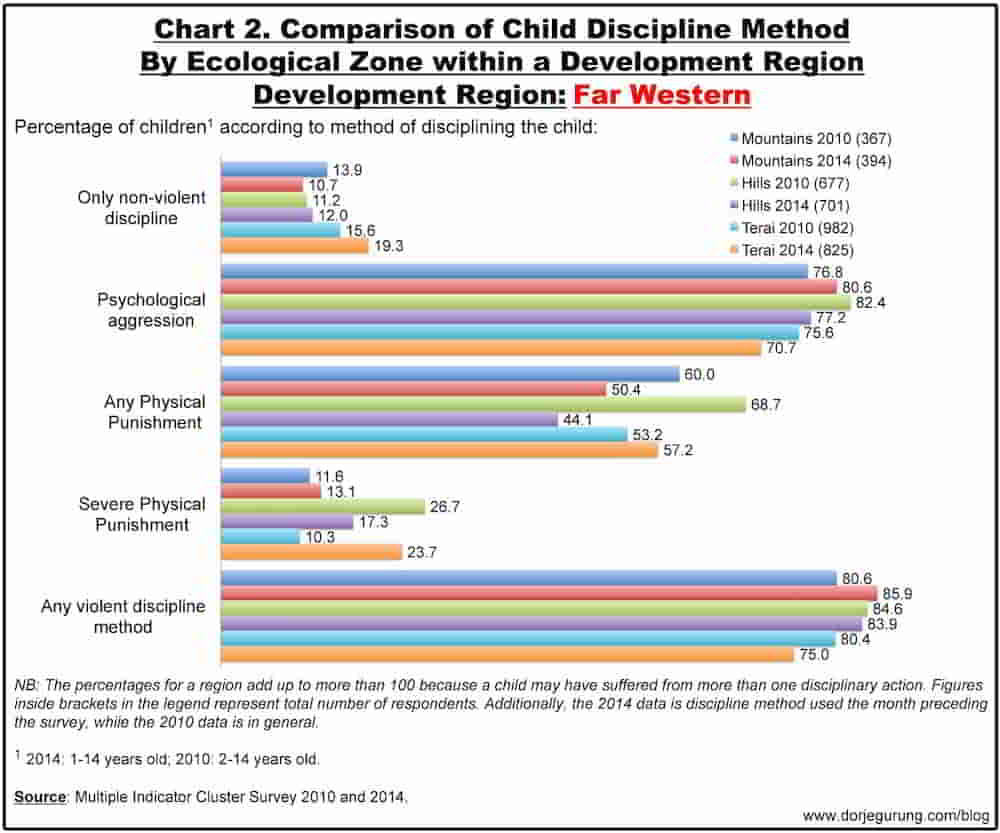
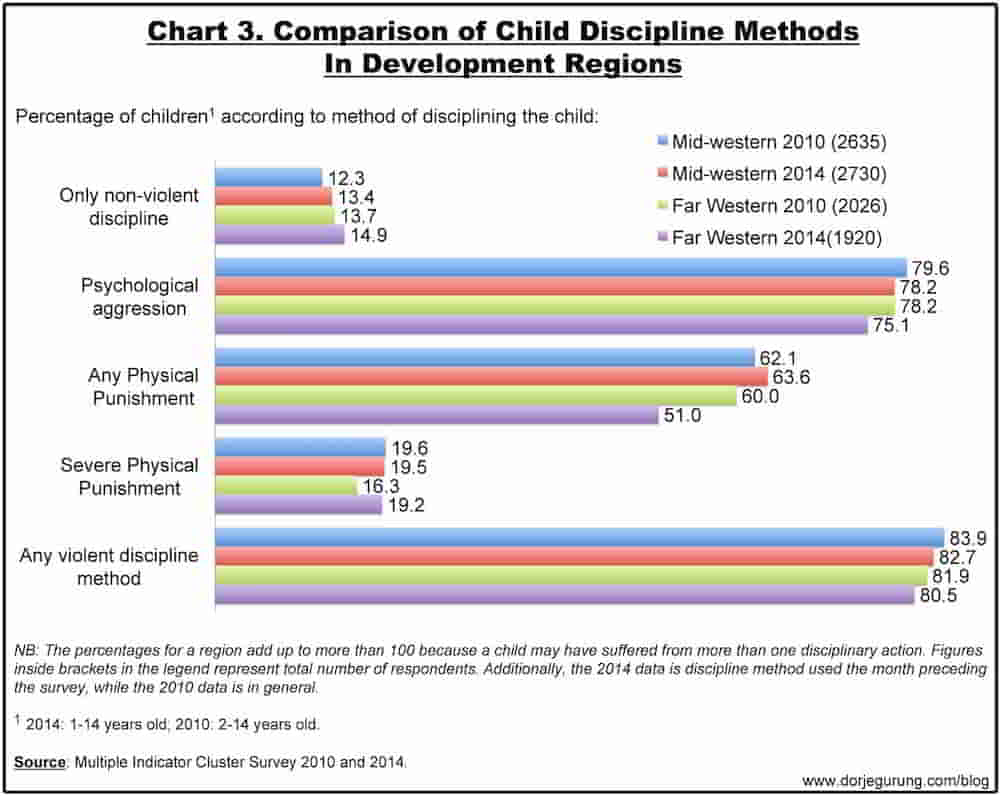
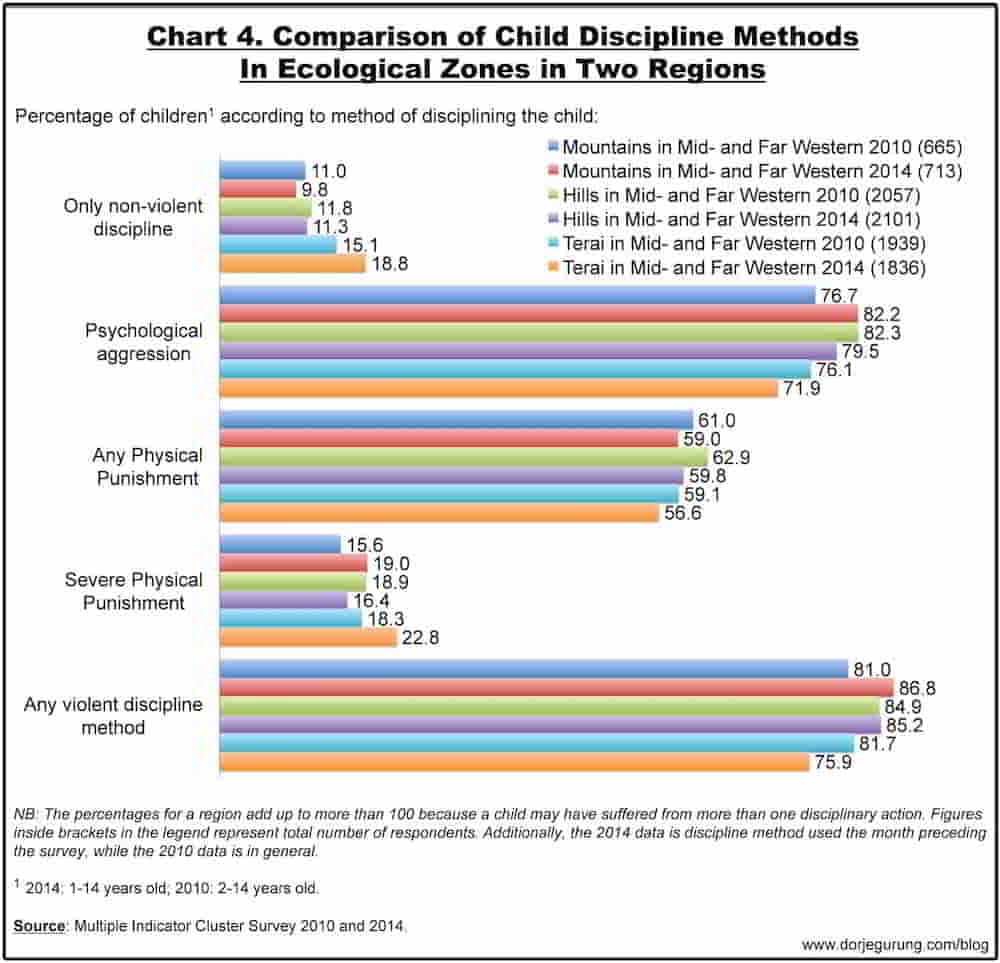
What do you think?
