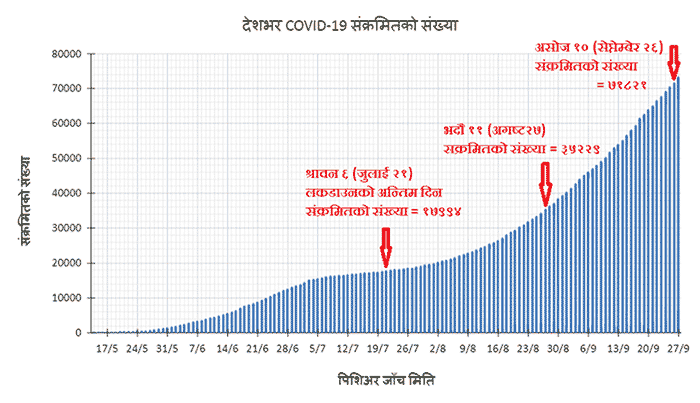
On July 21, the last day of Lockdown 1.0, the total number of cases was 17994. When that about doubled (to 35229) the day was Aug. 27. That in turn about doubled to 71821 on Sept. 26. This blog post will look at how the demographics of those infected with the coronavirus changes and why that indicates that we are in stage 3 of the pandemic in the country.
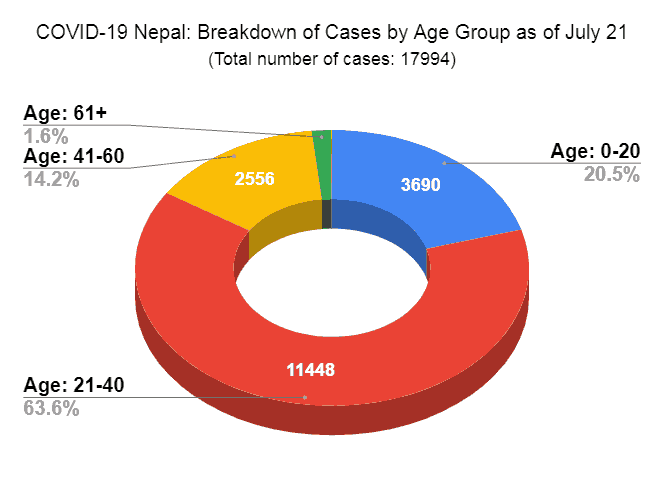
To begin with, here’s the breakdown of the July 21 cases by age group.
At over half of all the cases (63.6%), the 21-40 age group is the most represented group. That is followed by the 0-20 group representing a fifth (20.5%) of all the cases. Notice, the age group that has been identified as the most vulnerable of all the groups above — those over 60 — represent less than 2%!
Here’s a further breaks down of the cases and age groups by gender.
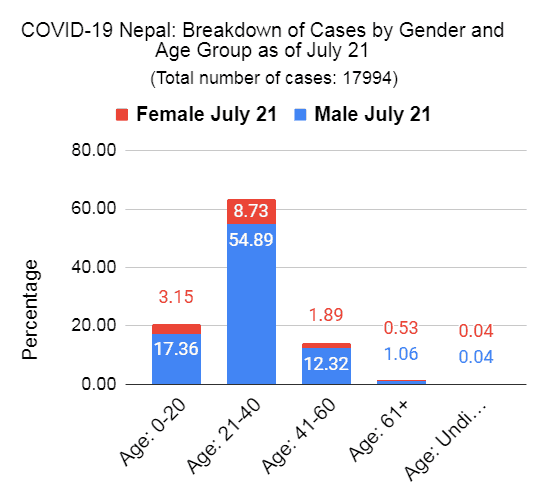
Notice, firstly, that female cases relative to the males in every age group is significantly smaller except in the over sixty group, which again, let me remind is really small compared to the rest. Secondly, though NOT indicated in the chart, the absolute numbers of the female cases are also relatively small.
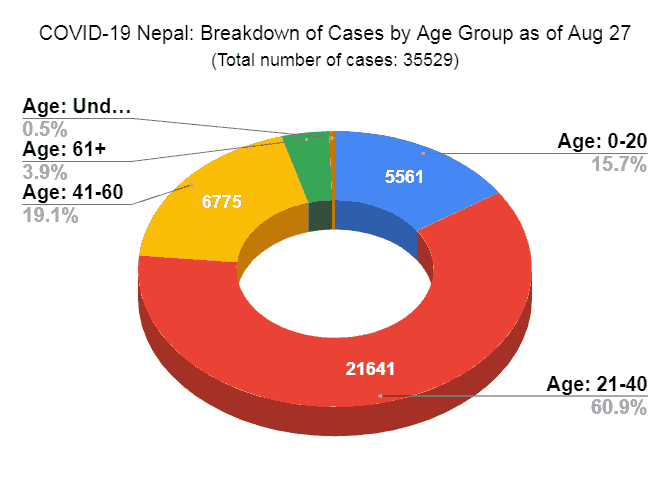
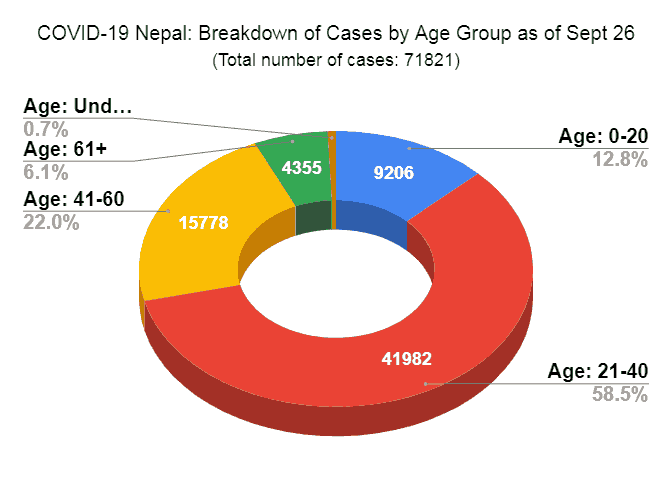
The demographics changes quite dramatically from July 21 to Aug. 27, when the cases double. Here, to begin with, is the demographics of the Aug. 27 cases by age group.
The most important things to note between the above pie chart and the chart for July 21 are the following:
- The percentages of the highly represented age groups, 21-40 and 0-20 have gone down (by about 3% and 5% respectively).
- The percentages of the lower represented groups, 41-60 and 61+ have increased (by about 5% and 2% respectively).
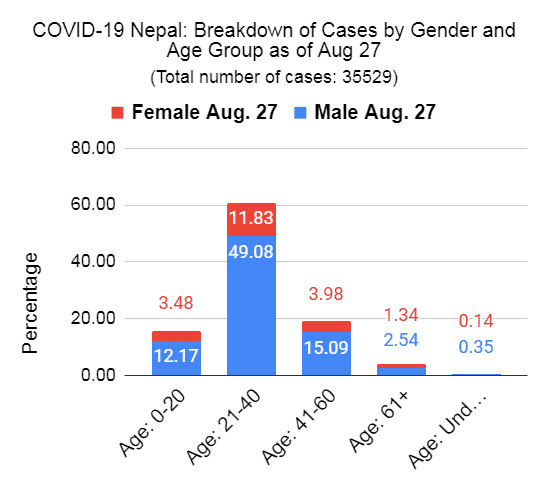
Look at the breakdown along gender lines, however, and you’ll notice something peculiar.
Where there’s been a drop in the relative numbers — in the 0-20 and 21-40 age groups — the drop is only in the males.
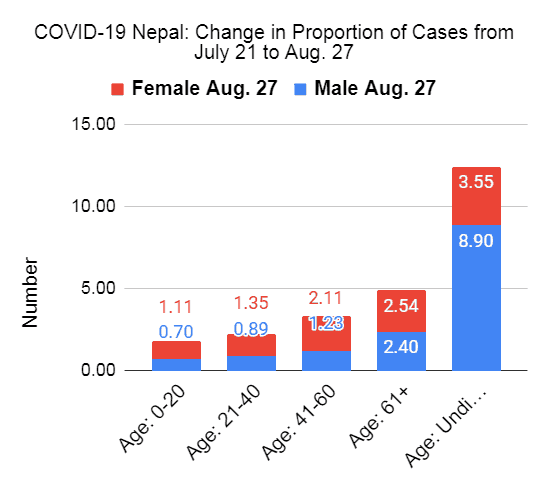
MOST importantly however, the proportional change in the percentage of the vulnerable group (see histogram below) is the highest! While the total number of cases doubled, one age group saw their number more than DOUBLE and that was the 61+ group, the most vulnerable group.
The chart below shows that very clearly AND more.
The more is another demographics that more than doubled in proportion: females in the 41-60 age group.
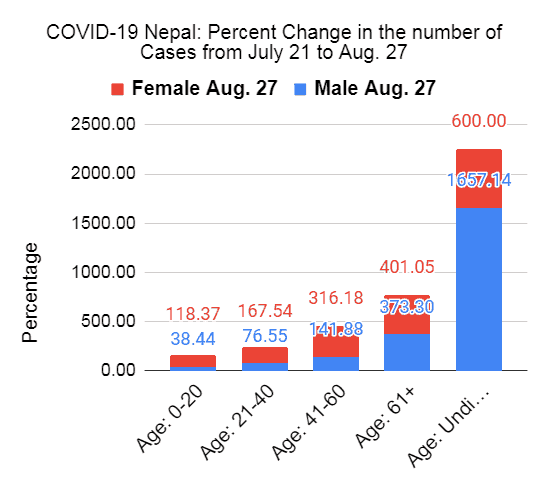
How did the absolute numbers change? Here it is.
Note a few things:
- Except for males in the 0-20 and 21-40 age groups with less than 100% increase, every other age group saw their numbers more than double.
- The number of cases of females in EVERY SINGLE age group more than doubled — percent increase in every case is over 100%.
- The highest increase — with their numbers almost increasing by 5-fold (401%) over the period — was of females aged 61 and over.
- That’s followed by males in the 61 and over group whose numbers (at 373% increase) also more than quadrupled.
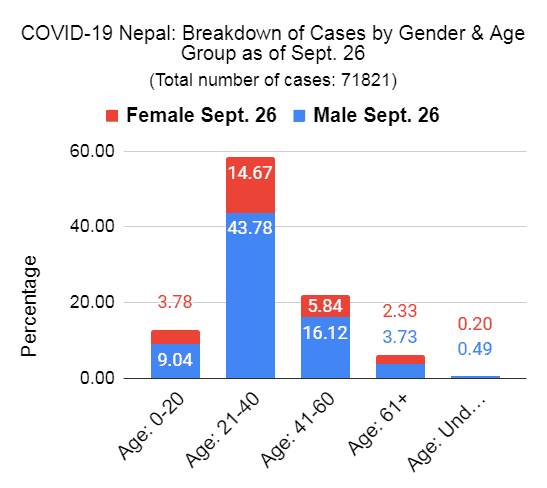
What happens going from Aug. 27 to Sept. 26? Much worse…when it comes to the females!
Again, the percentages of the 0-20 and 21-40 age groups decrease while those of the other two increase. And, again, the increases are disproportionately of females in the group.
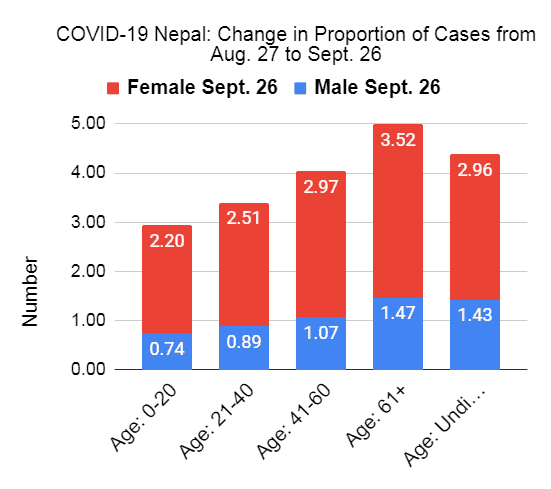
The histogram below gives a better picture of the higher proportional increase of the females over the males.
Note two things:
- The proportion of EVERY SINGLE female age group MORE THAN DOUBLES, with the highest increase in the 61+ age group, the most vulnerable group.
- The proportion of males in the 0-20 and 21-40 age groups decreases again.
The change in absolute numbers, the histogram below, paints an even bleaker picture.
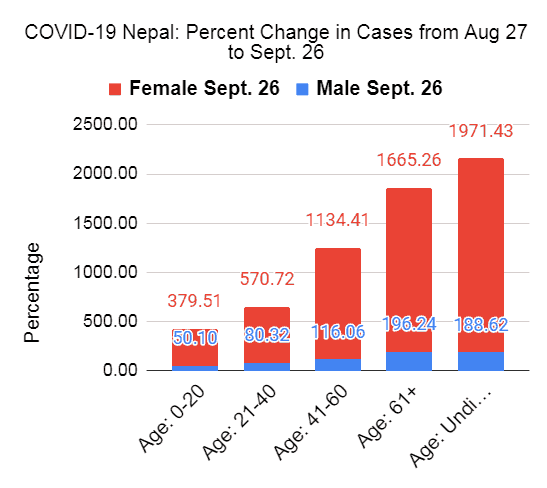
Note the following:
- Even as the total number of cases doubled during the period, while the absolute number of cases of males in the age groups 0-20 and 21-40 increase they don’t double — they increase by less than 100%.
- The absolute number of cases of males in the other age groups do more than double but
- the number of female cases increases by leaps and bounds, from quadrupling (0-20 age group) to increasing by over 17-fold (61+ age group)!!
Over the course of a little over two months — starting in July 21 — when the cases grew exponentially, the proportion and number of cases of the demographics traditionally and relatively less active and mobile — namely females and senior citizens – have grown in an alarming rate. That suggests house-hold and community level transmission of the coronavirus in the country — very likely from the young or younger to the old. This stage of a pandemic is referred to as Stage 3.
Stage 4 is “when massive number of people start getting infected and the measures to contain the virus or control the number of affected patients seem almost impossible.”
Incidentally, that we are exposing the most vulnerable age group at a higher and higher rate is a worrisome trend.
Given that the country has NOT implemented any strategy to really mitigate the spread of the virus during this second wave AND that there does NOT seem to be any signs that we will, as I see it, there is little chance of us avoiding stage 4.
What do you think?
(यो बिषयमा नेपालीमा लेखेको लेख पद्नुहुने इच्छा छ भने ६१ वर्षमाथिको उमेर समूहमा संक्रमण बढ्नु चिन्ताको विषय पढ्नुहोस् |)
(If interested in other blog post about the status of COVID-19 in Nepal, click here, here, here, here, here, here, here, here, and here.)

