Given the complete lack of strategy on the part of our Government to tackle the coronavirus pandemic, the end of the four-month long lockdown 1.0 on July 21 did NOT bode well for the country. One of the things I have been doing on Twitter is to expose that by sharing my own observations of the progress of the pandemic offering my own observations. The observations are based mostly on charts I generate using the Google Drive spreadsheet I maintain. My data source are the situation reports published by the Ministry of Health and Population.
Reproduced below, with some minor corrections, please find the content of the tweet thread I shared on September 5. I preserved the format of the tweets, hence the appearance, as well as the language. (I opted to do this — over embedding the tweets — for ease of viewing the charts. Please don’t mind the hastags and the language!)
1/
As a #ScienceTeacher, 2 important #transferable #skills I sought to impart were:
- asking Q’s, &
- drawing #EvidenceBased #conclusions/making #DataDriven arguments.
Here’s me asking some questions & drawing TENTATIVE conclusions abt these & other #COVID19 charts. #Nepal.
2/
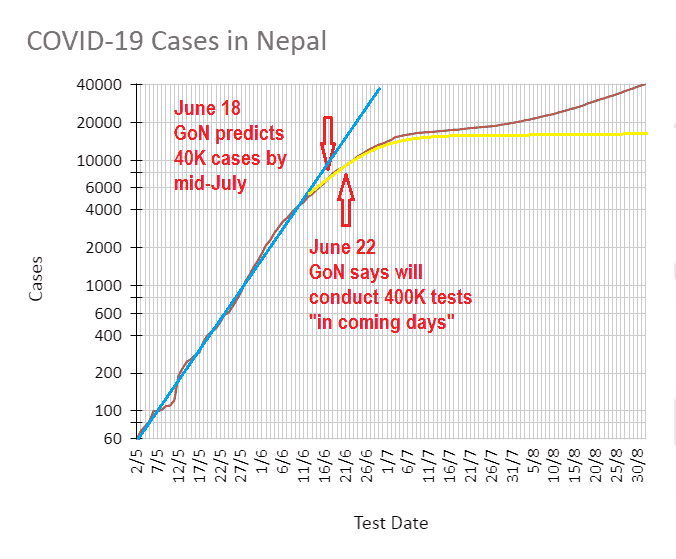
In June, cases had begin showing #ExponentialGrowth (upward sloping blue line in d log scale chart below).
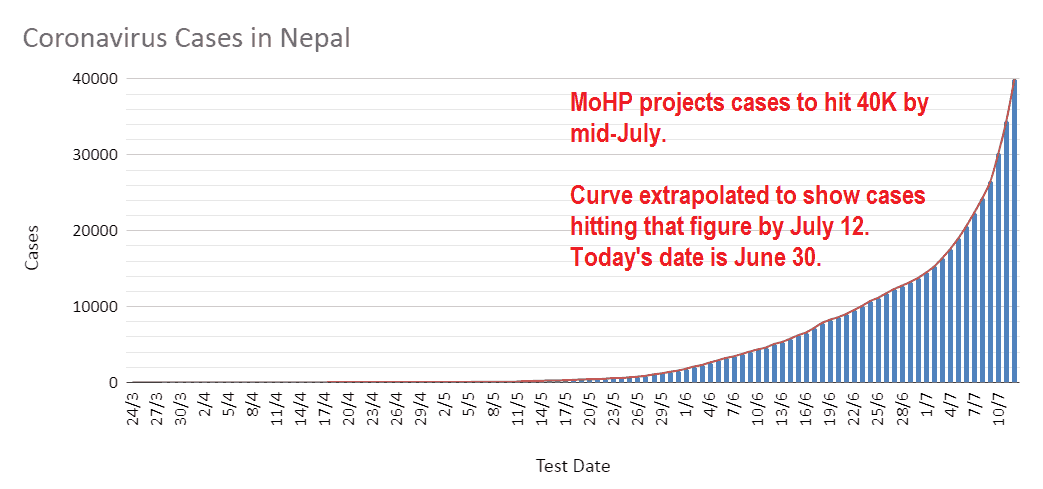
Even GoN on June 18 predicted cases to reach 40K my mid-July. Extrapolation conforming to that prediction resulted in d 2nd chart below. #Nepal #COVID19 #COVID19Nepal
.3/
But when it DIDN’T continue on that path, d optimistic (though unrealistic!) possibility was for the curve to flattened (yellow curve [in chart 1 above]). The Government of #Nepal did announce on June 22 (https://kathmandupost.com/national/2020/06/22/pcr-test-kits-procured-by-nepal-army-incompatible-with-most-nepali-laboratories) that they would be conducting 400K tests “in the coming days.”
.4/
BUT neither happened!
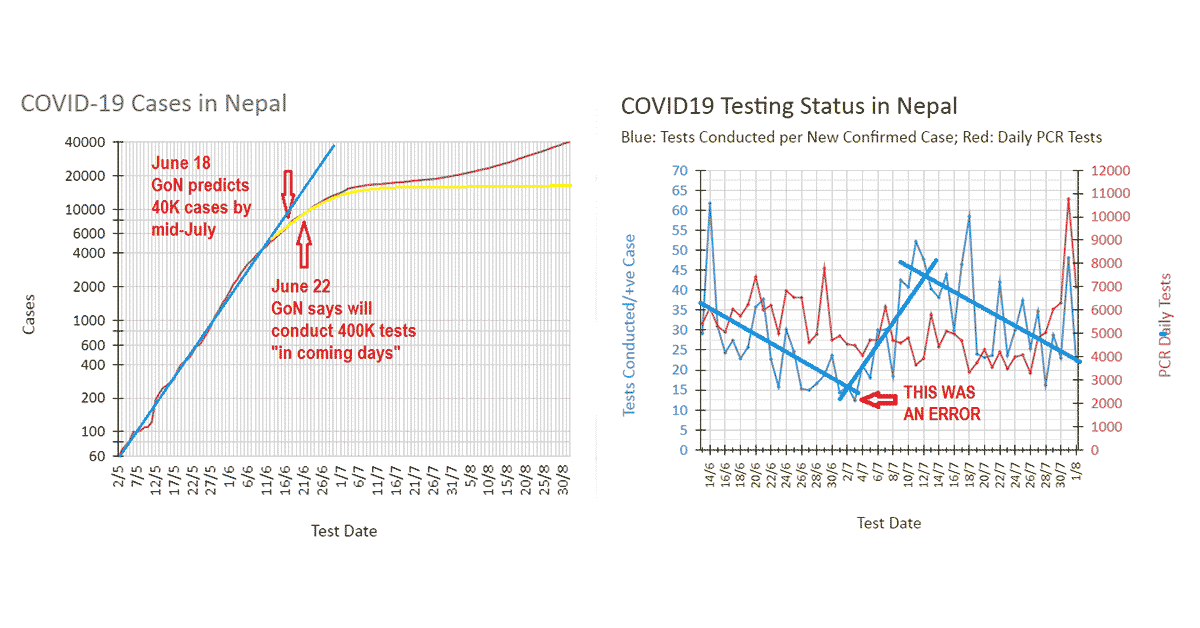
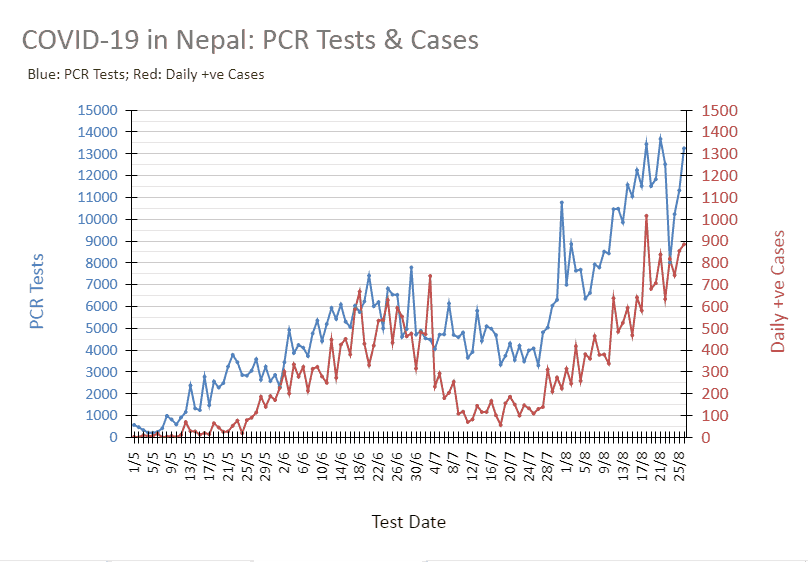
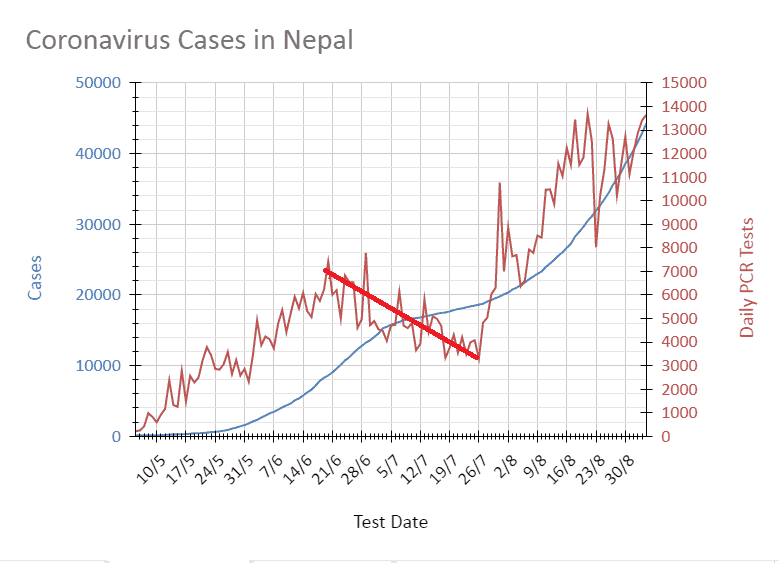
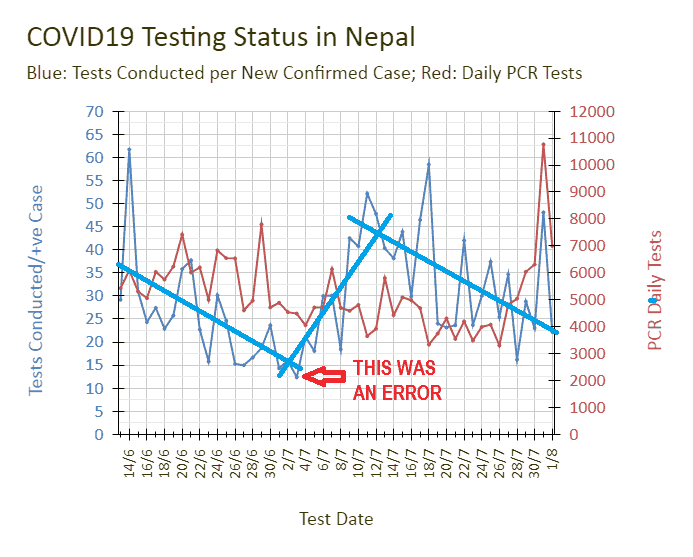
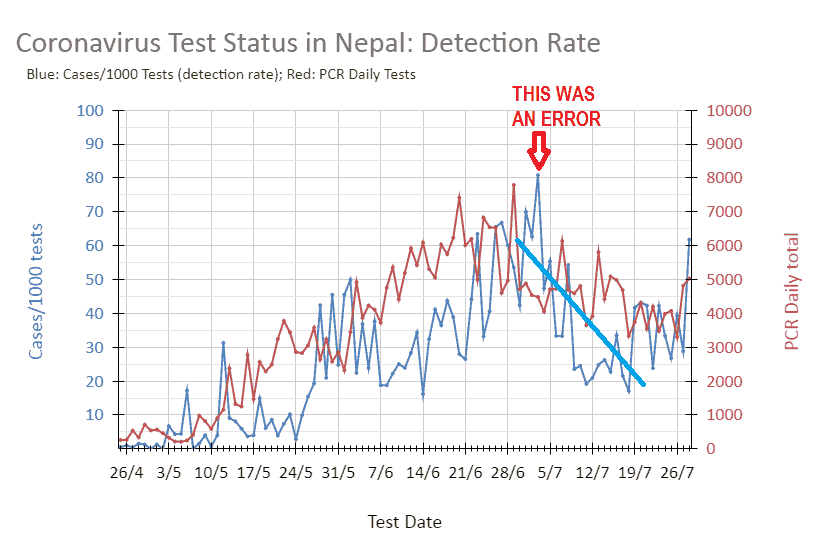
What happened instead was #DetectionRate starting to drop (BLUE line image 1) & total cases starting to level off leading to a slow down in the #ExponentialGrowth (https://twitter.com/Dorje_sDooing/status/1298633569699471360?s=20 [see below for a reproduction]) before picking up again.
#Nepal #COVID #COVID19 #COVID19Nepal
The following are a reproduction of the relevant tweets one of which is linked to in the above tweet. (They are from Aug. 26.)
How has the number of #COVID19 cases in #Nepal been progressing?
As haphazard as our testing has been & therefore d results, here it is:
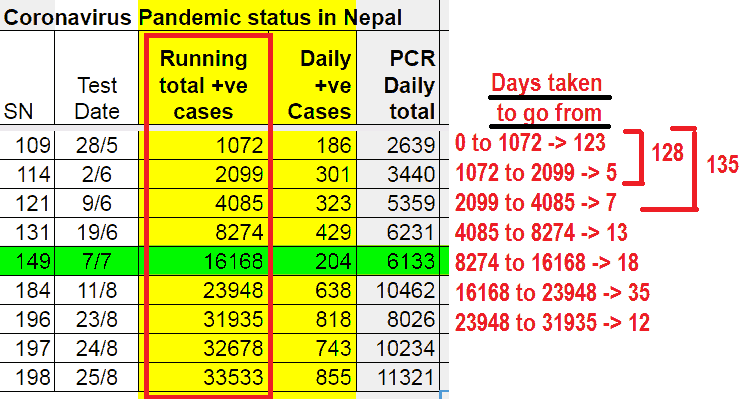
1st 1K, took 123 days.
2nd 1K took just 5.1st 2K, took 128 days.
2nd 2K took just 7 days.1st 4K took 135 days.
2nd 4K only 13 days.
.If you looked closely at the table you may have noticed an irregularity.
1st 8K (135+13) 148 days
2nd 8K 18 days
3rd 8K 35 days
4th 8 K 12 daysWondering why? Check chart for the answer.
(Hint: Check pattern in testing over the relevant period.) #Nepal #COVID #COVID19Nepal
.5/
So naturally, d question is why did NEITHER happen?
There’s probably a few different reasons behind that.
BUT,
1. as limited as our data is, &
2. as random & haphazard they are,
I’ll be making an argument based on them. #Nepal #COVID #COVID19 #COVID19Nepal #CovidData
.6/
1stly, notice how d drop in tests mirrors retardation in d growth of cases (image 1).
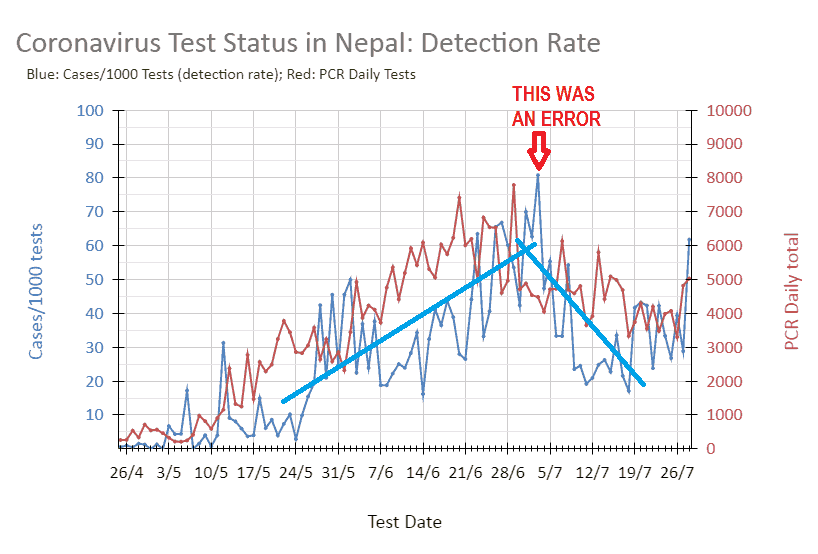
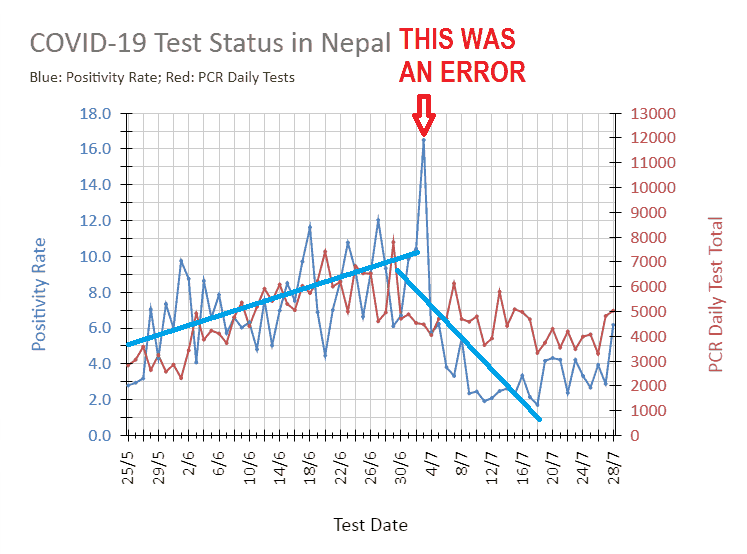
2ndly, notice how both rising #DetectionRate (image 2) & #PositivityRate (image 3) start on a downward trend also around d same time.
Not surprising ofc.
#Nepal #COVID19 #COVID19Nepal
.7/
BUT,
during that same period, as tests numbers are dropping, tests/confirmed case ALSO trends downward generally (with a little blip in d beginning of July when it trends upward for abt 9 days).
This HINTS at cases in d population rising, not falling! #Nepal #COVID19Nepal
.8/
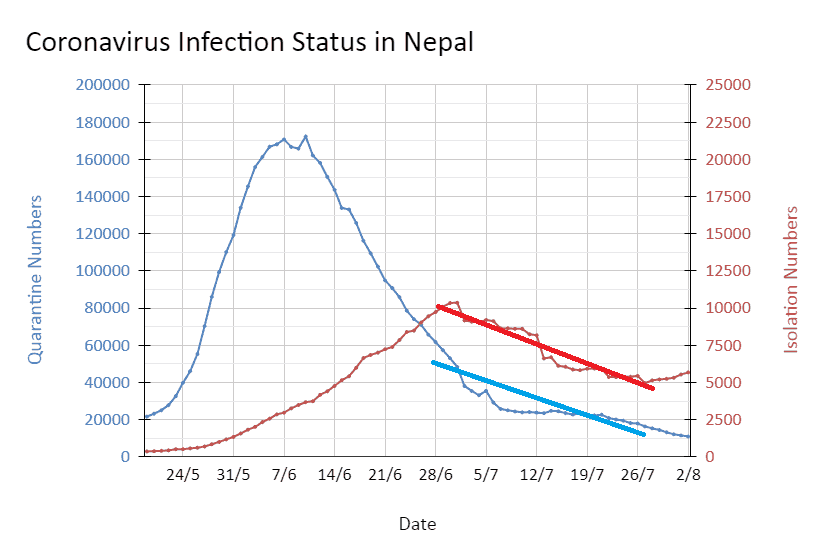
Unfortunately, far from increasing testing to reach d 400K goal & implementing a rigid mitigation strategy to avoid hitting d predicted 40K cases by mid-July, their strategy was leading to a gradual downward trend in d numbers in quarantine & isolation during d same period.
.9/
Going back to d virus actually spreading in the population but d detection & positivity rates NOT indicating that…
The explanation could lie in WHO they are testing &/or d LOW testing rate. #Nepal #COVID #COVID19 #covid19nepal
I rounded that off with a tweet quoting another thread I had made a number of days earlier.
.10/10
Following is clear NOW
1. curve could’ve been flattened easier, but didn’t
2. so contending with a 2nd & deadlier wave: w/ increasing testing rate, detection & positivity rates are increasing, & tests/confirmed case is decreasing. #Nepal #COVID19 https://t.co/gNnbERyzc9— Dorje Gurung, ScD (h.c.) (@Dorje_sDooing) September 5, 2020
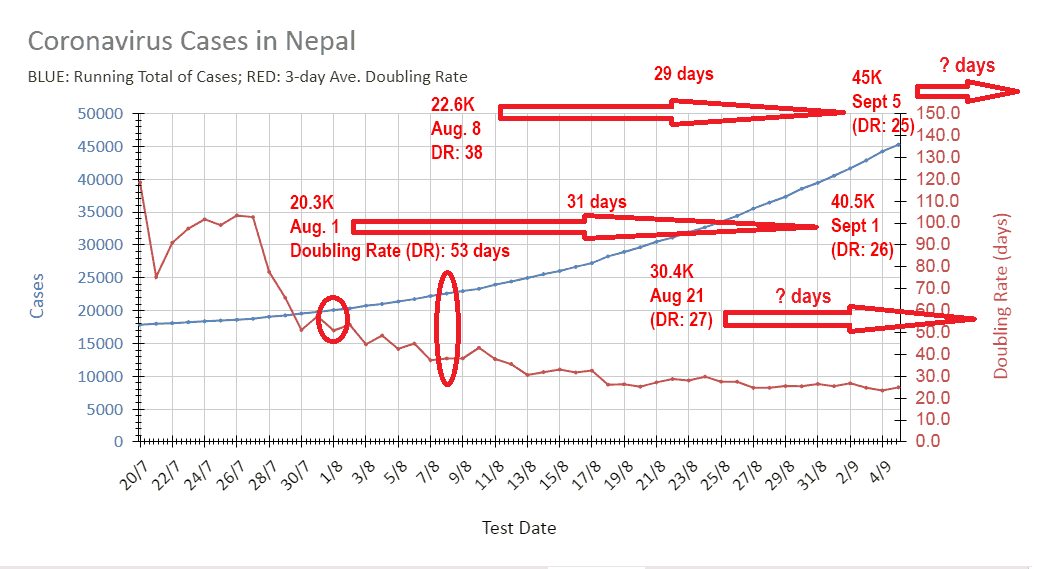
The next day I tweeted the following to highlight the fact that the REAL doubling rates are lower than predicted by the data.
Cases, doubling rate (DR in days) & actual
1/8: Cases: 20.3K; DR: 55. 2X on 1/9, 31 days later.
8/8: Cases: 22.6K; DR: 38. 2X on 5/9, 29 days later.
21/8: Cases: 30.4K; DR: 27, & 5/9: Cases: 45K; DR: 25. When will they double? Will depend on strategy of GoN!
#COVID19 #Nepal
NB. (Sept. 18, 2020) I have replaced the original chart demonstrating the flattening of the curve as an extrapolation on the log scale chart of cases (in yellow) as a curve that peaks and then slopes downward. Of course, when the curve is flattened, the rate at which the total cases increase slows and ultimately turns into a plateau as shown in the current version of the chart. Apologies for the mistake!
(If interested in other blog post about the status of COVID-19 in Nepal, click here, here, here, here, here, here, here, here, and here.)

