A shot blog post looking at how & why we failed with d containment of coronavirus & mitigation of it spread by considering data on testing — the data we have, as random & limited as they are — & what must happen as far as containment & mitigation are concerned now.
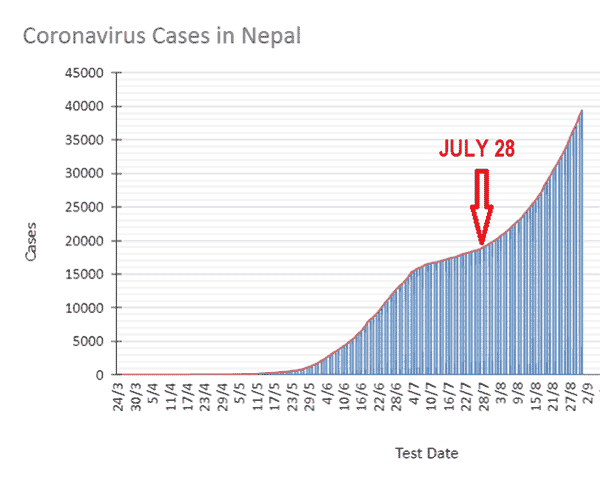
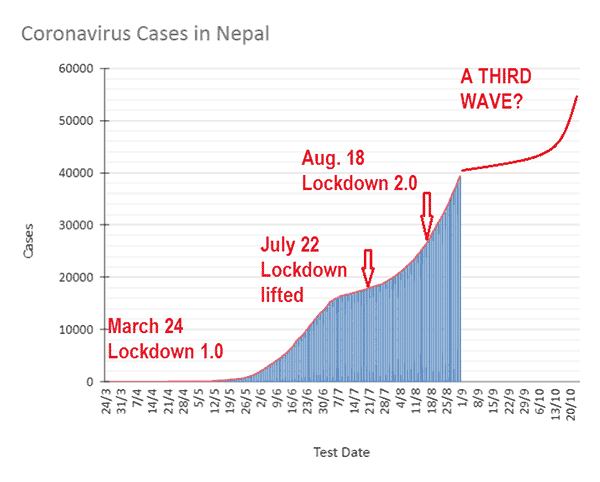
The first round of lockdown, which began on March 24 was lifted on July 22 and the second round of lockdown was begun on Aug 18. As you can see from the chart below, the number of cases have been climbing steadily from around July 28.
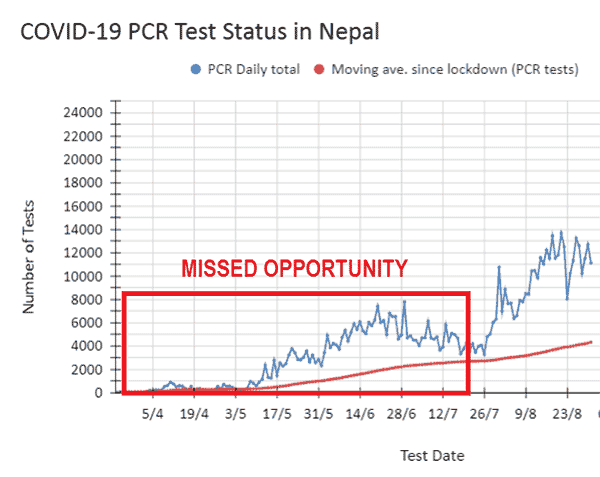
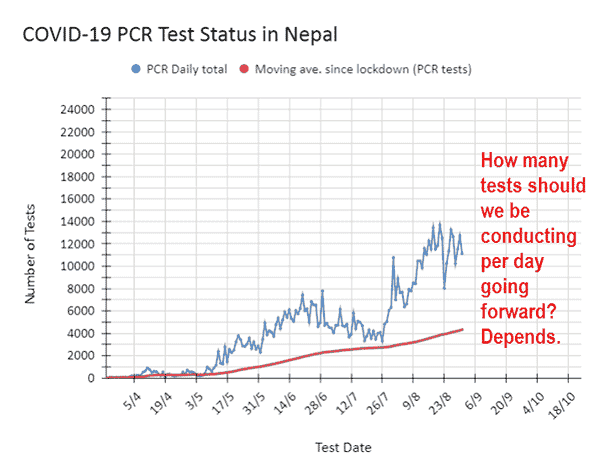
One of the most important things the Government of Nepal should have done during lockdown 1.0 — from March 24 to July 21 — was Mass Testing, which as you can see below, they didn’t. The highest daily test peaked at around 8K and even that just twice!
Apart from that they should have employed a rigid mitigation strategy also which they didn’t.
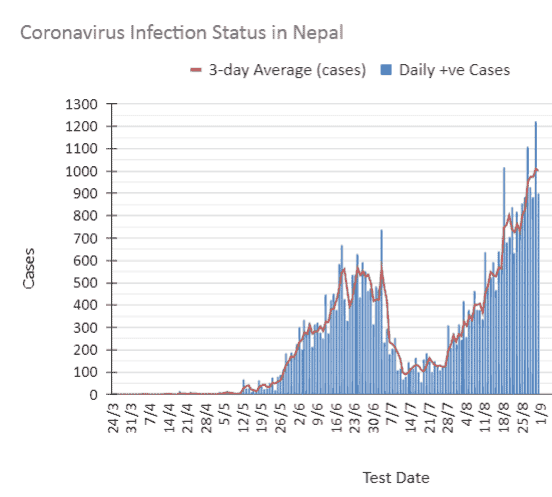
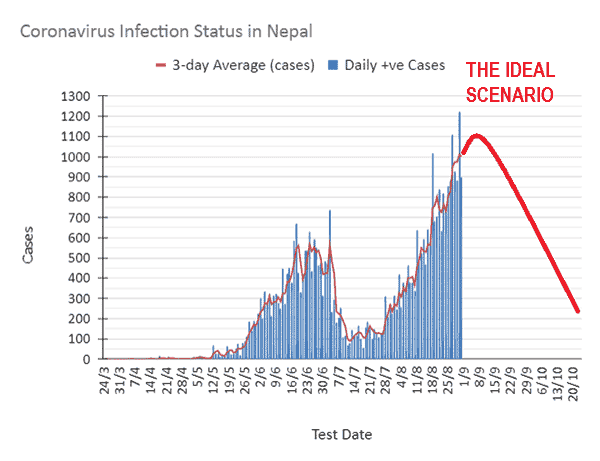
So now, because of that, what was feared or expected has come to pass: the second wave. Daily cases have been rising steadily since July 28, a week after lockdown was lifted (see image).
(Incubation period for the coronavirus is between 2 and 14 days. July 28 is seven days after lifting the lockdown.)
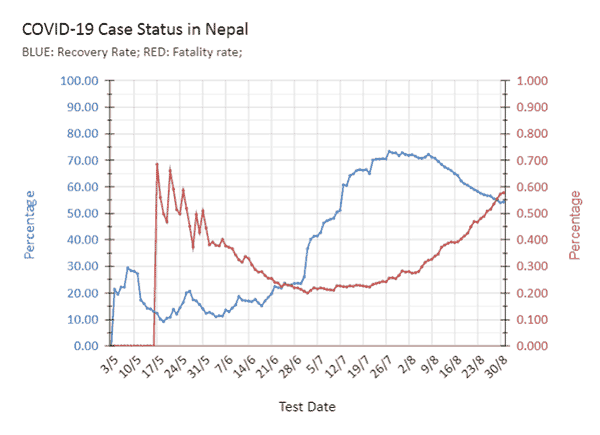
Fatality rate rose from 0.2% (2 out of 1000) on July 22 to 0.6% (6/1000) on Aug. 31 (red curve in the chart below). Recovery rate (blue curve) has been on the slide since Aug. 8. While it stood at 72% then, it’s around 54% now.
So what next?
After #lockdown 2.0, we’ll either
- have a repeat of what we are seeing, a third wave following a plateau, or
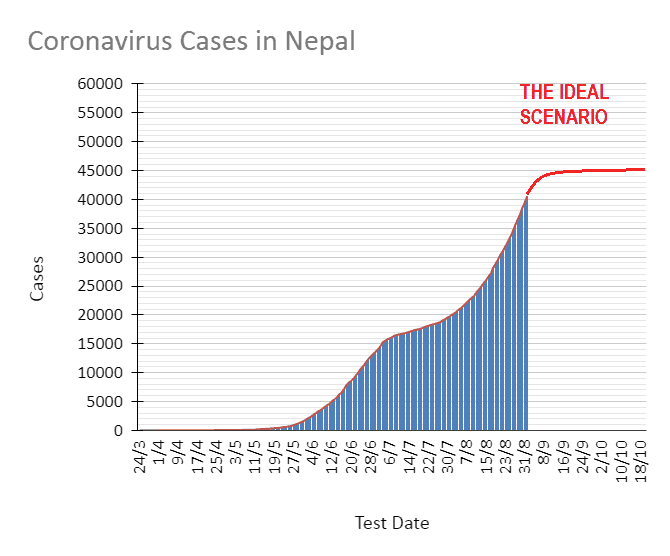
2. get on the path to flattening the curve (the ideal scenario).
(Yes, before the curve starts flattening, I’m pretty sure the number of cases will continue to rise and peak. For how long and when will it peak and at what is difficult to say. The days on the chart are there to just show them.)
Which of the two comes to pass will depend LARGELY on d strategy employed by our government.
What we must do to flatten the curve there is NO debate or question about. In addition to containment through lockdown, the government of Nepal’s strategy MUST ALSO be mitigation of the spread of the virus.
For that,
- mass testing,
- contact tracing, &
- isolation of the infected
MUST be carried out in EARNEST!!!
How has our testing been?
Forget about before July 28, even since that day when testing has been increasing (see chart below), they have STILL been inadequate.
What would be the appropriate level of mass testing?
Depends.
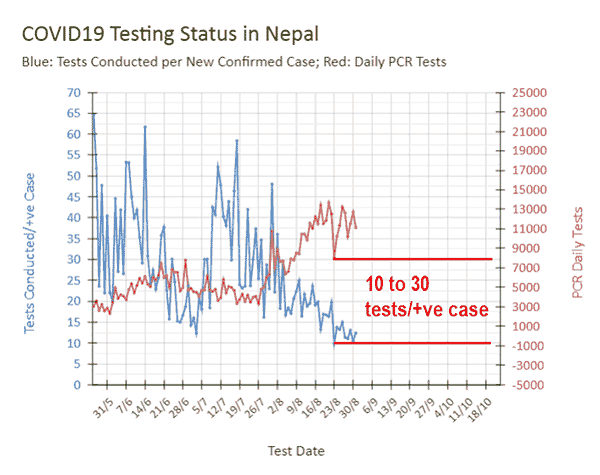
According to the WHO, “around 10-30 tests per confirmed case is a general benchmark of adequate testing.”
Again, while test numbers have been increasing since July 26 (red curve), tests conducted per confirmed case has been decreasing (blue curve).
What rate of testing in Nepal will ensure we hit that 10-30 test per confirmed case of coronavirus infection benchmark?
Difficult to say. There’s only one way to find out though: INCREASE the testing rate.
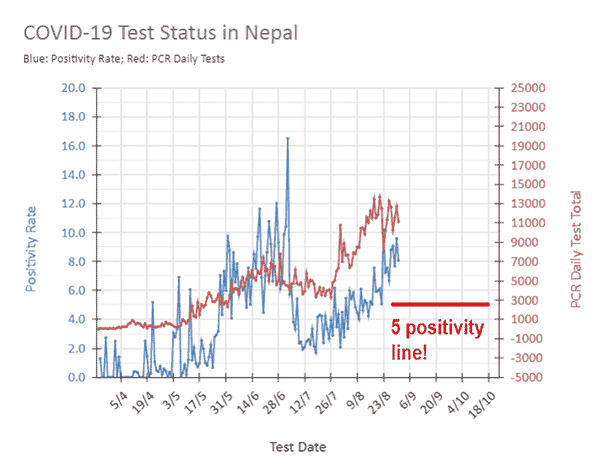
Looking at positivity rate, according to the WHO, “less than 5% is ONE indicator that the epidemic is under control in a country.”
The positivity rate has been increasing steadily on average since July 12 (blue curve). It crossed the 5% mark on Aug. 23 and now stands at around 8% now!
So the question, just as before, naturally is: What testing rate will reduce positivity rate to <5%?
Only one way to find out… but you know that already!
What about isolation and quarantine numbers?
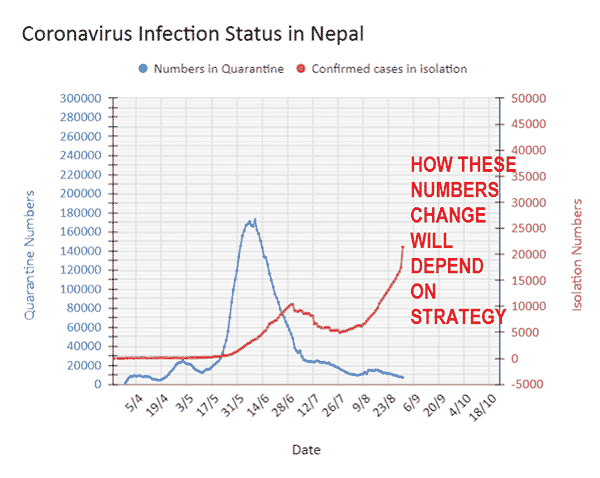
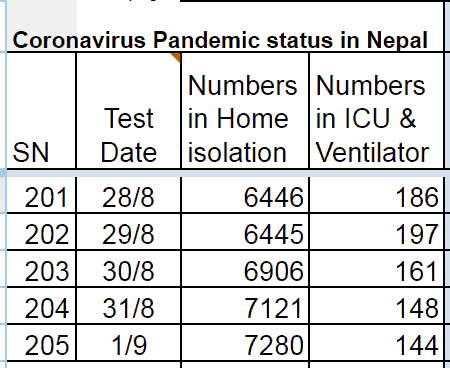
Isolation numbers dropped from June 29 to July 27 and then have been have been rising steadily since July 27 and sharply recently, which, of course is good or bad depending on d reason behind it.
Ours? It is bad!
Had the government done a really good job before July 27, the drop in the their numbers wouldn’t have been so large and so steady. That in turn would have meant that the numbers wouldn’t have gone up so steadily and sharply of late.
Quarantine numbers, have been dropping too which, again, can be good or bad. The reason ours have been dropping is a bad one!
They dropped because, again, the government of Nepal failed to manage it well.
What’s worse now is that, apparently, they have started sending (asking) people (to) home quarantine.
Home quarantine sound innocuous but it could prove to be devastating as those around the sick might fail to take all the necessary precaution to keep themselves safe and increase the chances of spreading within the family and community.
The last blog post on the coronavirus in Nepal I published in early June, Coronavirus Pandemic in Nepal: No Strategy…So Say The Charts, I concluded…
…the complete lack of strategy and competency and, in its place, the abundance of arrogance and ignorance in those at the helms means that the whole situation turning into a major humanitarian crisis is a possibility.
All indications are that we are likely seeing the beginning of that humanitarian crisis! Apart from the risks of contracting and dying from coronavirus, apparently, up to 500 people show up for their only meal at the center of Kathmandu where a group serves a meal a day there, to give but just one example.
(तपाई यहाँ यो ब्लगको नेपाली version खोज्दै आउनुभएको हो भने यहाँ click गर्नुस |
NB. (Sept. 18, 2020.) I discovered an error in the depiction of the ideal scenario which has been corrected and reinforced with an additional image — one showing how the three-day moving average of daily cases should change over time. Apologies for the mistake.
(If interested in other blog post about the status of COVID-19 in Nepal, click here, here, here, here, here, here, here, and here.)

